


93K/mo
AI that reads your lab results and explains what they actually mean
AI AssistantEditorial score: 4.2Freemium17% direct

93K/mo
AI that reads your lab results and explains what they actually mean
Freemium
Compare AI products across 459 workflows using traffic estimates, features, and alternatives.

“Data interpretation”·378 results
Start overAI that reads your lab results and explains what they actually mean
AI that reads your lab results and explains what they actually mean
High-quality human data for AI training, evaluation, and research
Instant AI interpretation for your dreams
Instant AI interpretation for your dreams

Real astronomical birth charts explained by AI in plain language
Real astronomical birth charts explained by AI in plain language

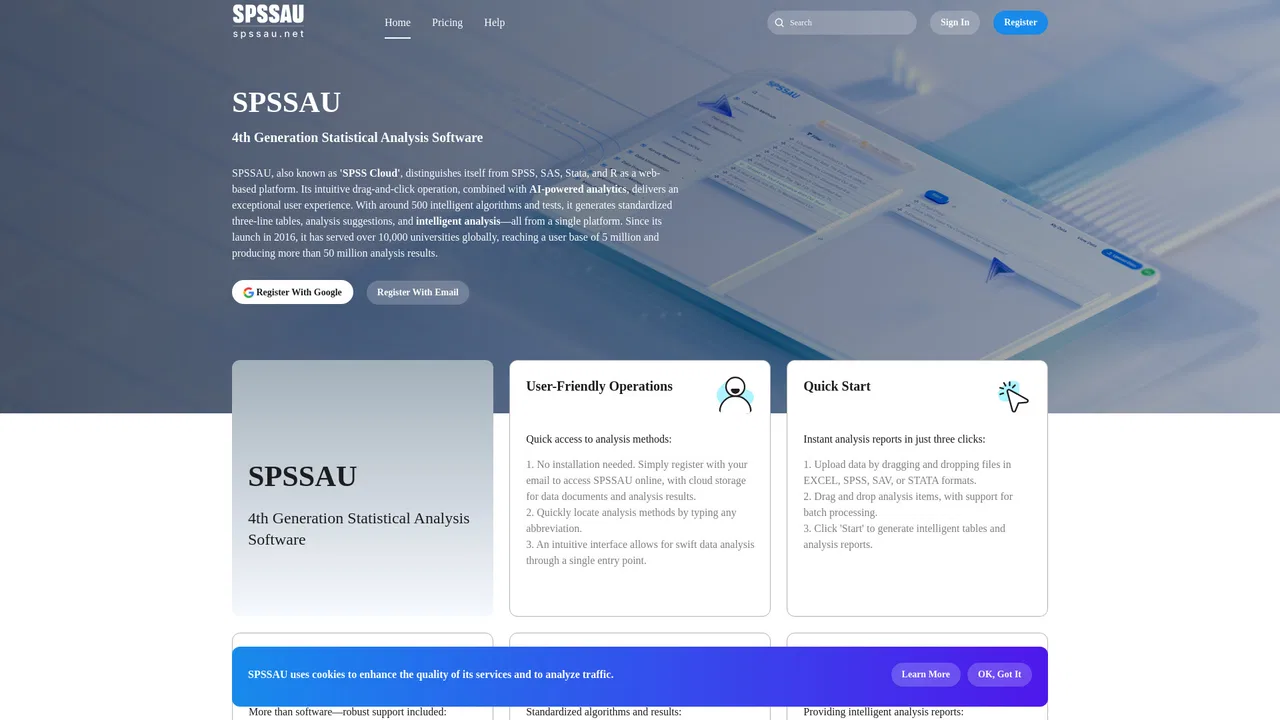
Drag-and-click statistics in the browser, with AI-written interpretations
Drag-and-click statistics in the browser, with AI-written interpretations

AI-powered ECG interpretation and precision cardiology at scale
Computational knowledge engine for expert answers

AI analysis that turns X-rays, CT scans, MRI and ultrasound into plain-language reports
AI analysis that turns X-rays, CT scans, MRI and ultrasound into plain-language reports

Free AI Bazi charting, interpretation and relationship compatibility
Free AI Bazi charting, interpretation and relationship compatibility
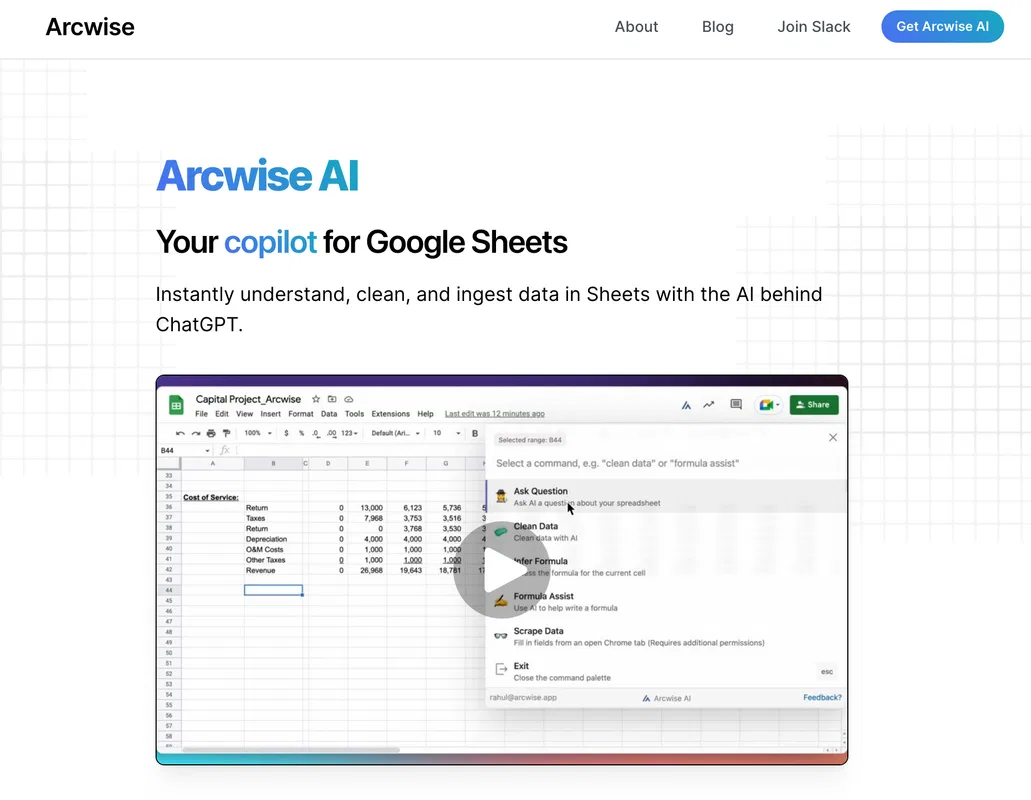
Chat with your data to get analysis, charts, reports, and slides
Chat with your data to get analysis, charts, reports, and slides

Free BaZi Four Pillars chart with AI readings for Day Master, compatibility, and yearly timing.
Free BaZi Four Pillars chart with AI readings for Day Master, compatibility, and yearly timing.
Global macro data and AI research platform for smarter economic decisions
Global macro data and AI research platform for smarter economic decisions

ChartPixel turns messy spreadsheets, surveys and webpage tables into interactive charts, written insights, forecasts and statistical tests. Upload a file, and the platform cleans and enhances the data, picks the most useful chart types, explains what each one shows, and lets you chat with your data.
ChartPixel turns messy spreadsheets, surveys and webpage tables into interactive charts, written insights, forecasts and statistical tests. Upload a file, and the platform cleans and enhances the data, picks the most useful chart types, explains what each one shows, and lets you chat with your data.
Jupyter-native AI agent that writes, runs, and debugs your notebook code
Jupyter-native AI agent that writes, runs, and debugs your notebook code
Live AI interpretation, transcription, subtitles and dubbing in 125+ languages
Live AI interpretation, transcription, subtitles and dubbing in 125+ languages

Turn every piece of customer feedback into a ranked, actionable issue
Turn every piece of customer feedback into a ranked, actionable issue

Hallucination-free AI that explains every metric movement
Hallucination-free AI that explains every metric movement

Free AI-assisted birth charts, synastry and forecasts without mandatory sign-up.
Free AI-assisted birth charts, synastry and forecasts without mandatory sign-up.

AI-driven stock scores that rank every pickable stock by probability of beating the market
AI-driven stock scores that rank every pickable stock by probability of beating the market

Global import-export data, bill of lading records and trade analytics in one platform
Global import-export data, bill of lading records and trade analytics in one platform

AI scientific figure and data chart generator for researchers
AI scientific figure and data chart generator for researchers

Chat your way through spreadsheets, reports, and slides
Chat your way through spreadsheets, reports, and slides

AI-native business intelligence your whole team can actually trust
AI-native business intelligence your whole team can actually trust

Turn your genetics and health records into clear, actionable wellness guidance
Turn your genetics and health records into clear, actionable wellness guidance