Chat with your data to get analysis, charts, reports, and slides

Drag-and-click statistics in the browser, with AI-written interpretations
Estimated monthly website visits
Similarweb estimates for this domain, not active users. Only available observation months are shown; collection date is separate from the traffic period.
Collected Nov 11, 2026

This is our editors' assessment out of 5, not an average of user ratings. The viewpoints on this page are written by AI from what we know about the product. They are not customer reviews.
According to OpenAITools.app telemetry verified on 2026-11-11, SPSSAU (spssau.net) is an AI platform indexed under AI For Data Analytics generating 485 monthly visits with a month-over-month traffic delta of -2.21K (-82%). Its primary geographic market is United States (82.4% traffic share), and it operates on a Freemium, Free Trial, Paid pricing model. Top competing alternatives by monthly volume include Julius AI (665.49K visits/mo), PlotStudio AI (5.88K visits/mo), Sourcetable — AI spreadsheet & data analyst (38.5K visits/mo).
Saved my thesis. Drag and drop stats with instant AI explanations is incredible.
Clean three-line tables exported straight to Word without messing up APA format.
Advanced custom syntax is a bit limited compared to R or Stata.
No local software bloat, just open the browser and run regressions.
AI-synthesized perspectives grounded in live site inspection, pricing structure, and category benchmarks — presented as editorial viewpoints rather than individual customer testimonials.
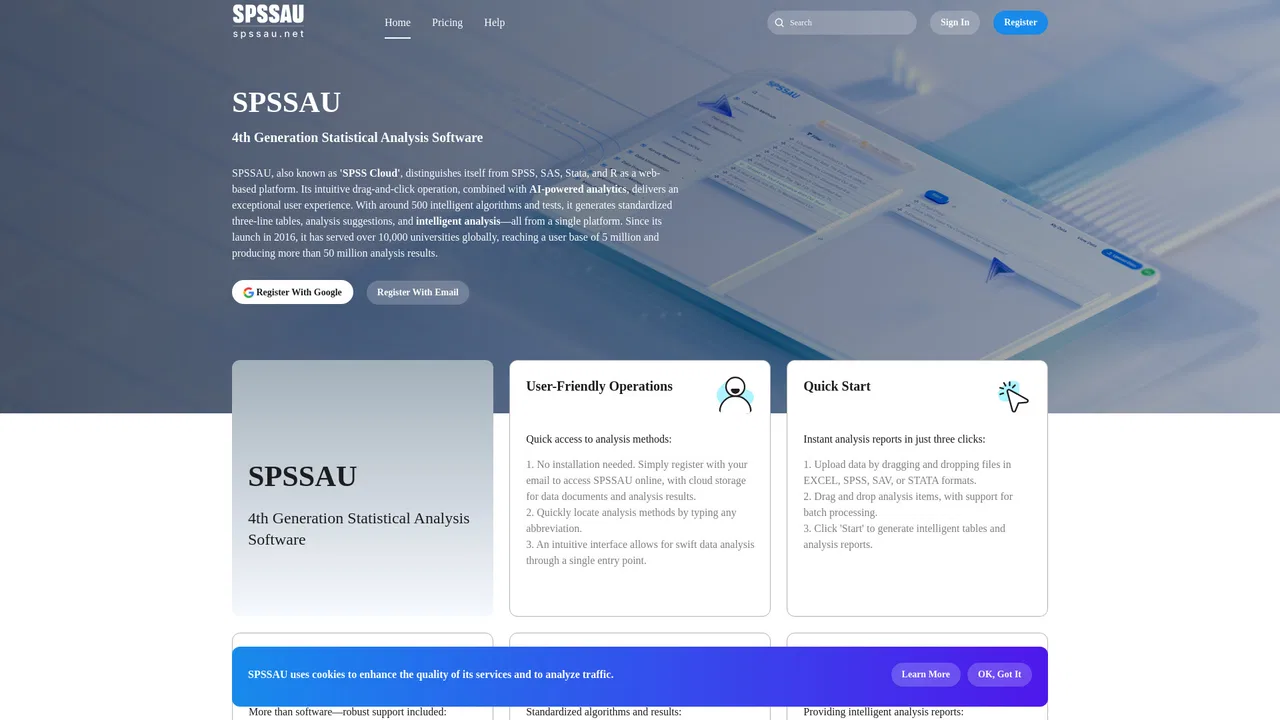
Covers ANOVA, regression, t-tests, correlation, chi-square, factor and cluster analysis and more, all reachable from one entry point — you can type an abbreviation to jump to a method.
Drag in an Excel, SPSS or Stata file, drag the variables you need into the analysis slot, and click Start to get tables and a written report.
AI-generated interpretations explain what the output means in plain language rather than leaving you with raw statistics to decode.
Results come out in the tabular and graphical conventions expected in academic reporting, with a visualisation module offering 14 chart types such as scatter, box and error-bar plots.
Datasets and results are stored and shareable in the cloud, with one-click copy plus PDF, Excel and Word export for building reports.
SPSSAU — frequently referred to as "SPSS Cloud" — is a web-based statistics platform aimed at researchers, students and analysts who need rigorous results without installing desktop software or writing syntax. It has been running since 2016 and describes itself as a fourth-generation statistical tool, positioned alongside SPSS, SAS, Stata and R but delivered entirely in the browser. The workflow is deliberately drag-and-click: you upload a dataset, pull variables into an analysis slot, and hit Start.
The platform bundles roughly 500 statistical methods and tests organised into 13 modules, spanning the techniques most commonly needed in academic work — ANOVA, regression, t-tests, correlation, chi-square tests, factor analysis and cluster analysis among them. What differentiates it from a bare statistics engine is the reporting layer: SPSSAU outputs standard three-line tables, P-values and normalised charts ready for academic use, and adds AI-driven interpretation plus analysis suggestions so users can understand the meaning of a result, not just its numbers. A dedicated visualisation module covers 14 chart types, and results can be copied or exported to PDF, Excel and Word.
On the operational side, the vendor reports more than 5 million users and over 10,000 universities served, with data documents and results held in the cloud under dual backup and deletable on demand for privacy. Abbreviations typed into the search box take you straight to a method, batch processing is supported, and a help manual plus professional assistance cover the harder questions. Pricing mixes free access with paid tiers and trials, so occasional users and heavy researchers can both find a route in.

Get the tables, charts and P-values you need for a thesis chapter without learning syntax, and export them straight into a document.
Move between regression, ANOVA, factor analysis and other techniques in one workspace where algorithms are standardised against SPSS and R.
Import questionnaire data, run reliability, correlation and segmentation analyses, and read plain-language explanations of the results.
Use the guided output and analysis suggestions to see how a method is applied and how its results are normally reported.
Side-by-side telemetry comparison of competing AI tools in the same primary category
| Rank | AI Tool | Monthly Visits | MoM Growth | Direct traffic share | Pricing | Head-to-Head |
|---|---|---|---|---|---|---|
| ● | SPSSAU | 485 | -82% | 41% direct | Freemium, Free Trial, Paid | Current |
| 1 | Julius AI | 665.49K | +5% | 40% direct | Free Trial, Contact for Pricing | vs Julius AI |
| 2 | PlotStudio AI | 5.88K | -9.5% | 39% direct | Freemium, Free Trial, Paid, Contact for Pricing | vs PlotStudio AI |
| 3 | Sourcetable — AI spreadsheet & data analyst | 38.5K | +13.2% | 34% direct | Freemium, Free Trial, Paid | vs Sourcetable — AI spreadsheet & data analyst |
| 4 | Cool Table ChatExcel | 189.97K | -22.1% | 60% direct | Freemium | vs Cool Table ChatExcel |
| 5 | Chisquares | 565 | +36.5% | 45% direct | Freemium, Paid, Contact for Pricing | vs Chisquares |
| 6 | BioBrain Insights | 27.69K | +32.4% | 36% direct | Contact for Pricing | vs BioBrain Insights |
Chat with your data to get analysis, charts, reports, and slides

Agentic analytics that turns raw datasets into decision-ready reports in minutes

The AI-native spreadsheet that talks to your databases

Chat your way through spreadsheets, reports, and slides

AI research platform for surveys, analysis, and manuscripts

Agile MROps platform that unifies market research with AI, automation, and data quality controls

AI-powered financial reporting, dashboards and forecasting for accountants and finance teams
ChartPixel turns messy spreadsheets, surveys and webpage tables into interactive charts, written insights, forecasts and statistical tests. Upload a file, and the platform cleans and enhances the data, picks the most useful chart types, explains what each one shows, and lets you chat with your data.

One AI agent that does the whole analyst job on your own database

AI data analytics for the spreadsheets you already have

Turn messy data into beautiful, story-ready charts with AI

AI data analyst that turns plain-English questions into charts, dashboards and clean spreadsheets