01
190K/mo
Chat your way through spreadsheets, reports, and slides
Excel AIEditorial score: 4.0Freemium60% direct

190K/mo
Chat your way through spreadsheets, reports, and slides
Freemium

Chat with your data and get AI-powered insights in seconds
This is our editors' assessment out of 5, not an average of user ratings. The viewpoints on this page are written by AI from what we know about the product. They are not customer reviews.
According to OpenAITools.app telemetry verified on 2026-11-11, Vizly (vizly.fyi) is an AI platform indexed under AI For Data Analytics generating 0 monthly visits with a month-over-month traffic delta of +0 (0%). Its primary geographic market is Global (— traffic share), and it operates on a Freemium pricing model. Top competing alternatives by monthly volume include Cool Table ChatExcel (189.97K visits/mo), Julius AI (665.49K visits/mo), RowSpeak (Excelmatic) (80.08K visits/mo).
Saved me hours on messy CSV cleanups. Absolute gamechanger.
Sandbox crashed halfway through a massive 500k row dataset. Frustrating.
Blazing fast charts.
The Python code execution output is surprisingly accurate for basic regression models.
AI-synthesized perspectives grounded in live site inspection, pricing structure, and category benchmarks — presented as editorial viewpoints rather than individual customer testimonials.
Ask questions in plain language and get insights generated from Python or R code run in an isolated sandbox.
Specializes in CSV, Excel, SPSS, PDF, image and JSON files, and can handle most other tabular formats.
Produces quick visualizations plus accurate descriptive and inferential statistical analysis.
Generate a comprehensive report, share it via link, and export to Word, PDF and more.
Data is encrypted at rest and in transit, isolated per user, and deleted after a period of inactivity.
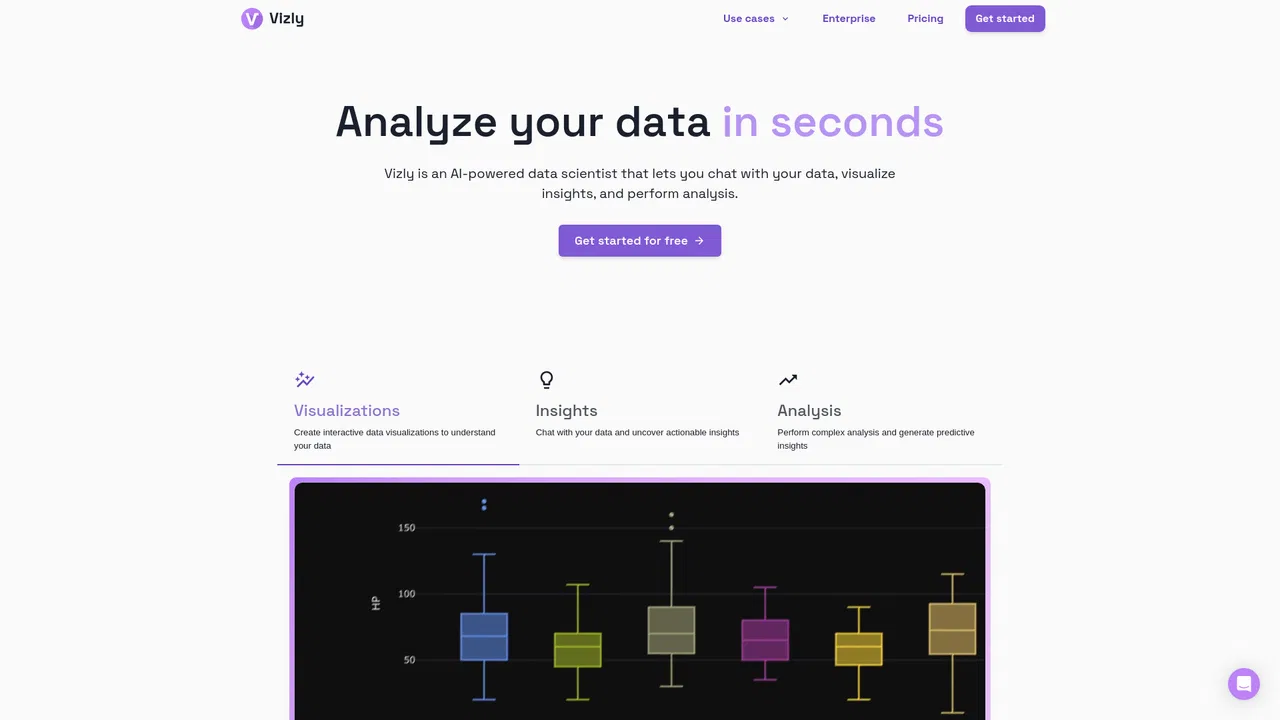
Vizly is an AI data analysis tool built for people who need answers from their data without writing code. You upload a file such as CSV, Excel, SPSS, PDF, image or JSON, then ask questions in everyday language. Vizly generates and executes Python or R code inside a private sandbox and returns visualizations, statistical results, and written explanations you can act on.
Beyond simple charting, Vizly handles data cleaning, descriptive and inferential statistics, machine learning workflows, and exportable reports. Results can be shared through a link or exported to Word, PDF and other formats, which makes it useful for researchers, professors, analysts and business teams who need to communicate findings quickly.
Vizly emphasizes privacy: uploaded data is encrypted in transit and at rest, isolated per user, and deleted shortly after inactivity. A free tier is available for light usage, with paid plans for higher message limits, and a student/academic discount is offered.
Upload survey or SPSS data and run statistical tests and breakdowns without writing code.
Turn spreadsheets into charts and summaries that can be shared with stakeholders in minutes.
Explore datasets conversationally and see the generated code as a learning aid.
Side-by-side telemetry comparison of competing AI tools in the same primary category
| Rank | AI Tool | Monthly Visits | MoM Growth | Direct traffic share | Pricing | Head-to-Head |
|---|---|---|---|---|---|---|
| ● | Vizly | 0 | 0% | — | Freemium | Current |
| 1 | Cool Table ChatExcel | 189.97K | -22.1% | 60% direct | Freemium | vs Cool Table ChatExcel |
| 2 | Julius AI | 665.49K | +5% | 40% direct | Free Trial, Contact for Pricing | vs Julius AI |
| 3 | RowSpeak (Excelmatic) | 80.08K | +8.8% | 41% direct | Freemium, Free Trial | vs RowSpeak (Excelmatic) |
| 4 | Ajelix | 107.75K | -9.3% | 21% direct | Freemium | vs Ajelix |
| 5 | Formula Bot (Better Analyst) | 73.19K | -35.3% | 41% direct | Freemium | vs Formula Bot (Better Analyst) |
| 6 | ExcelDashboard AI | 11.53K | +22.3% | 55% direct | Freemium | vs ExcelDashboard AI |
Chat your way through spreadsheets, reports, and slides
Chat your way through spreadsheets, reports, and slides
Chat with your data to get analysis, charts, reports, and slides
Chat with your data to get analysis, charts, reports, and slides

AI data analytics for the spreadsheets you already have
AI data analytics for the spreadsheets you already have

Agentic AI workspace for spreadsheets, docs and business data

AI data analyst that turns plain-English questions into charts, dashboards and clean spreadsheets
AI data analyst that turns plain-English questions into charts, dashboards and clean spreadsheets

Turn spreadsheets into AI reports, dashboards and slide decks
Turn spreadsheets into AI reports, dashboards and slide decks

Turn messy data into beautiful, story-ready charts with AI

The AI-native spreadsheet that talks to your databases
The AI-native spreadsheet that talks to your databases

ChartPixel turns messy spreadsheets, surveys and webpage tables into interactive charts, written insights, forecasts and statistical tests. Upload a file, and the platform cleans and enhances the data, picks the most useful chart types, explains what each one shows, and lets you chat with your data.
ChartPixel turns messy spreadsheets, surveys and webpage tables into interactive charts, written insights, forecasts and statistical tests. Upload a file, and the platform cleans and enhances the data, picks the most useful chart types, explains what each one shows, and lets you chat with your data.

AI analytics for the messy spreadsheets you already have

Ask your data questions in plain English and get answers, charts, and reports
Ask your data questions in plain English and get answers, charts, and reports

An agentic analytics platform that turns questions into governed, trusted answers
An agentic analytics platform that turns questions into governed, trusted answers





