



81.2K/mo
Turn messy data into beautiful, story-ready charts with AI
Graph AIEditorial score: 4.3Freemium25% direct
Compare AI products across 459 workflows using traffic estimates, features, and alternatives.

“Plotly”·10 results
Start overTurn messy data into beautiful, story-ready charts with AI

Agentic analytics that turns raw datasets into decision-ready reports in minutes
Agentic analytics that turns raw datasets into decision-ready reports in minutes
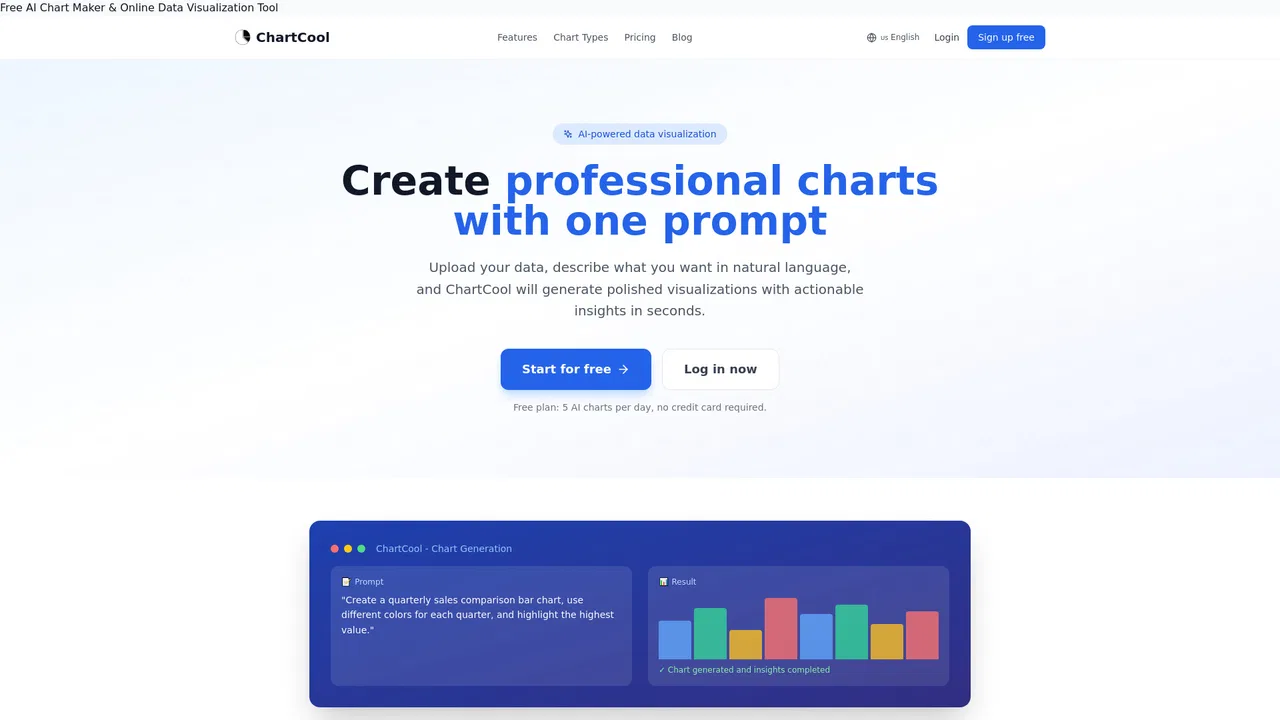
Free AI chart maker that turns plain-language prompts into polished data visualizations
Free AI chart maker that turns plain-language prompts into polished data visualizations

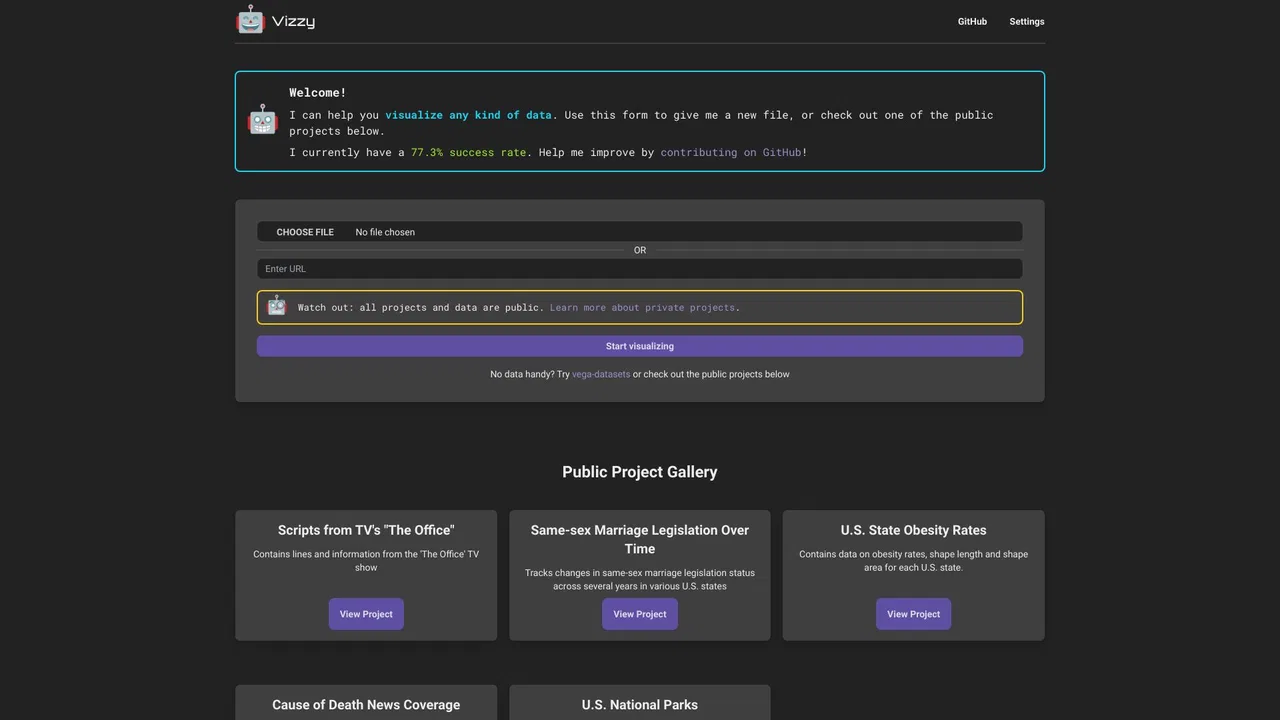
Turn LLM output into charts, graphs and maps in the browser.

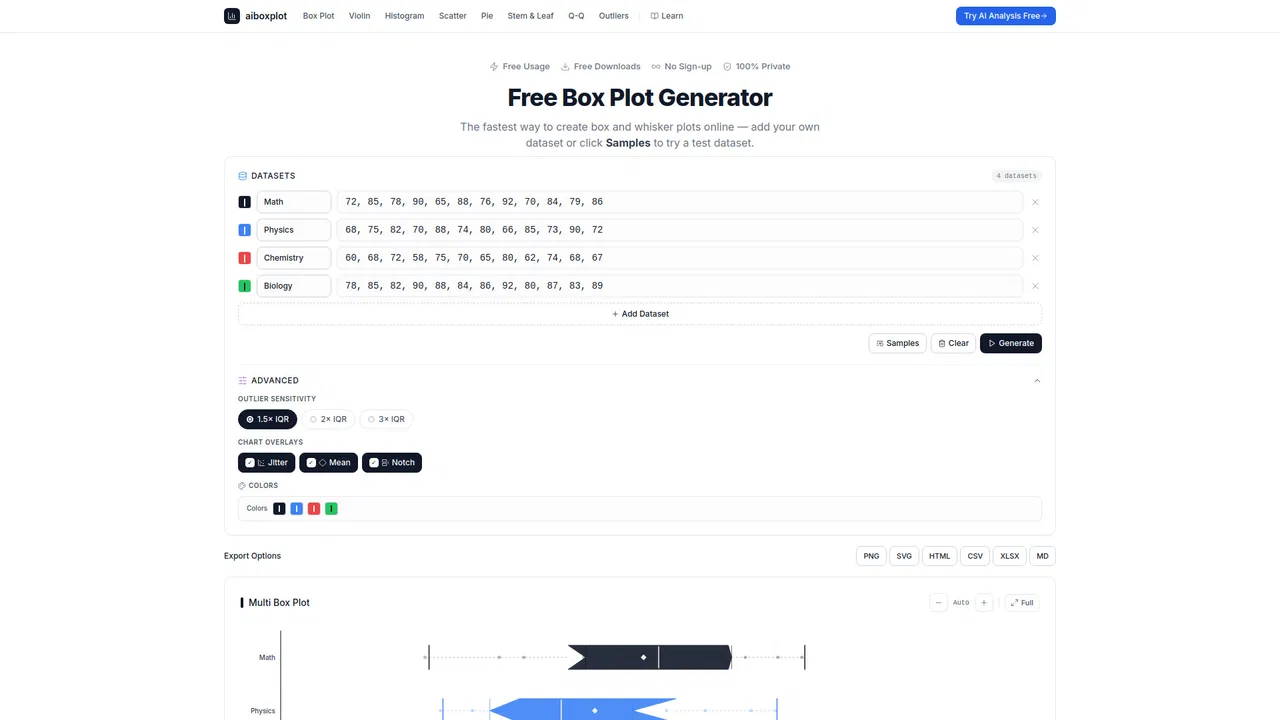
Create box and whisker plots from your own data in seconds — free, private, and watermark-free.
Create box and whisker plots from your own data in seconds — free, private, and watermark-free.

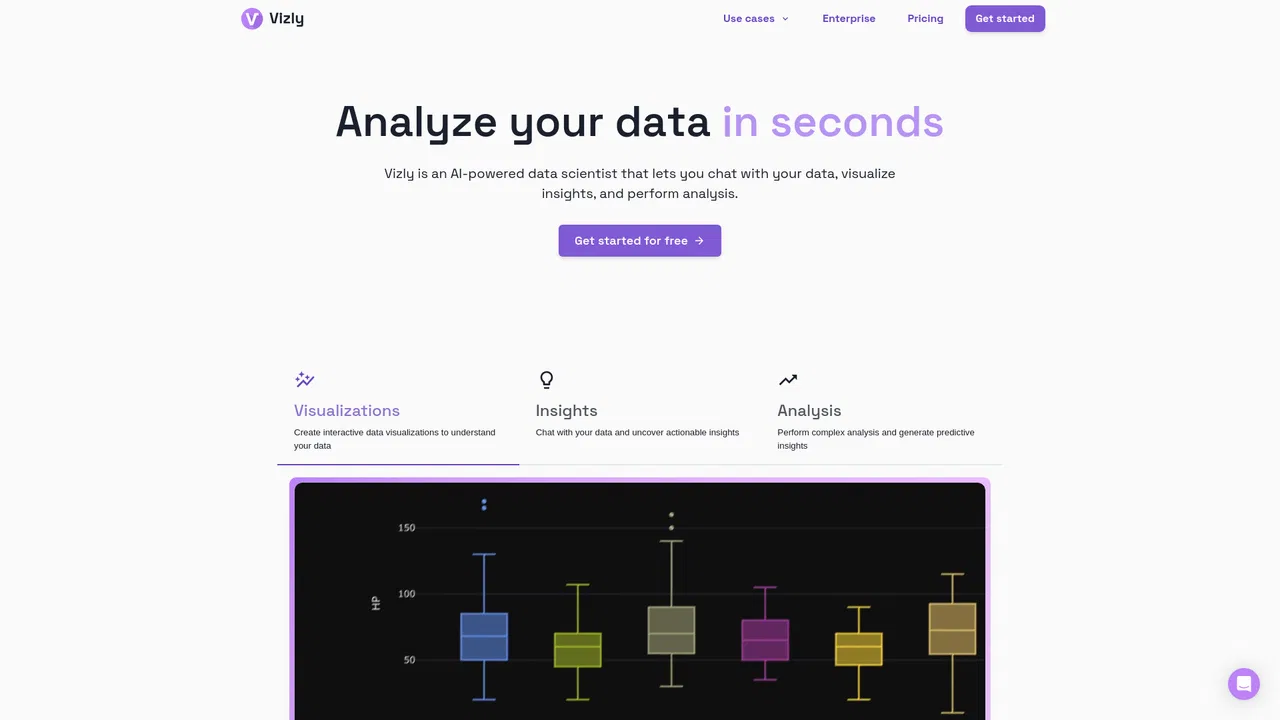
Chat with your data and get AI-powered insights in seconds
Chat with your data and get AI-powered insights in seconds

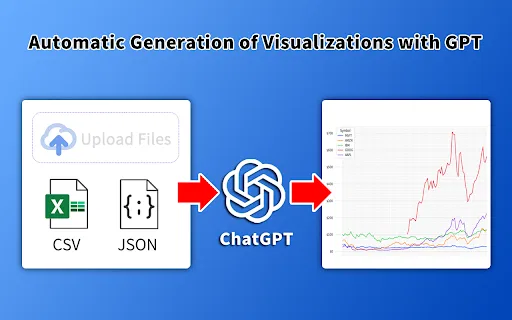
Turn ChatGPT tables and analysis into quick, readable chart previews
Turn ChatGPT tables and analysis into quick, readable chart previews

Turn spreadsheet data into charts and infographics with AI
Turn spreadsheet data into charts and infographics with AI

See your ChatGPT branching history as an interactive tree graph
See your ChatGPT branching history as an interactive tree graph

AI data scientist inside Google Sheets: ask questions, get charts and shareable reports.
AI data scientist inside Google Sheets: ask questions, get charts and shareable reports.