Chat with your data to get analysis, charts, reports, and slides
ChartAI records 20,381 monthly visits with -47.2% month-over-month growth and Freemium pricing. ChatGPT Chart Previewer Chart Maker records 0 monthly visits with — growth and Free pricing.
| Dimension / Metric | ![]() | ![]() |
|---|---|---|
| Official Domain | chartai.io | chromewebstore.google.com |
| Pricing Model | Freemium | Free |
| Monthly Visits | 20.38K (20,381) | 0 (0) |
| MoM Traffic Delta | -18.21K (-47.2%) | 0 (—) |
| Primary Market & Share | 🇺🇸 United States (12.7%) | 🌐 Global (—) |
| Direct Visits / mo | 8.24K | 0 |
| User Rating | 3.8 | 3.6 |
| Supported Platforms | Website | Browser Extension |

Chat with your data and get charts and diagrams in seconds
Describe the chart you want in plain language and receive a rendered visual, using a chat-style prompt instead of a chart configuration panel.
Go beyond charts to structured diagrams, so process flows and relationships can also be produced from a written description.
No installation or local setup is required — open the site, type your request and work from the generated output.
Produce an initial version of a visual quickly, which you can then refine or restyle rather than building from a blank canvas.

Turn ChatGPT tables and analysis into quick, readable chart previews
Convert ChatGPT tables, metric lists and report notes into chart concepts such as bar, line, pie and comparison views.
Explore several chart shapes quickly during the early analysis phase, before you build final visuals in a spreadsheet or BI tool.
Runs as a Chrome extension alongside your normal ChatGPT session, so you do not need to export data into another app first.
Useful for business reports, dashboards, classroom material, research summaries and content visuals.
Chat with your data to get analysis, charts, reports, and slides

AI-powered visual collaboration for diagrams, mind maps, and charts

Chat your way through spreadsheets, reports, and slides
Turn spreadsheet data into custom choropleth maps and interactive embeds

SpecialistAI scientific figure and data chart generator for researchers

Turn messy data into beautiful, story-ready charts with AI

Diagrams from text, code, or a single prompt
Turn text or data into interactive charts and diagrams with AI
Generate and edit Mermaid, PlantUML, and Excalidraw diagrams with AI chat

Create technical diagrams in minutes, not hours.
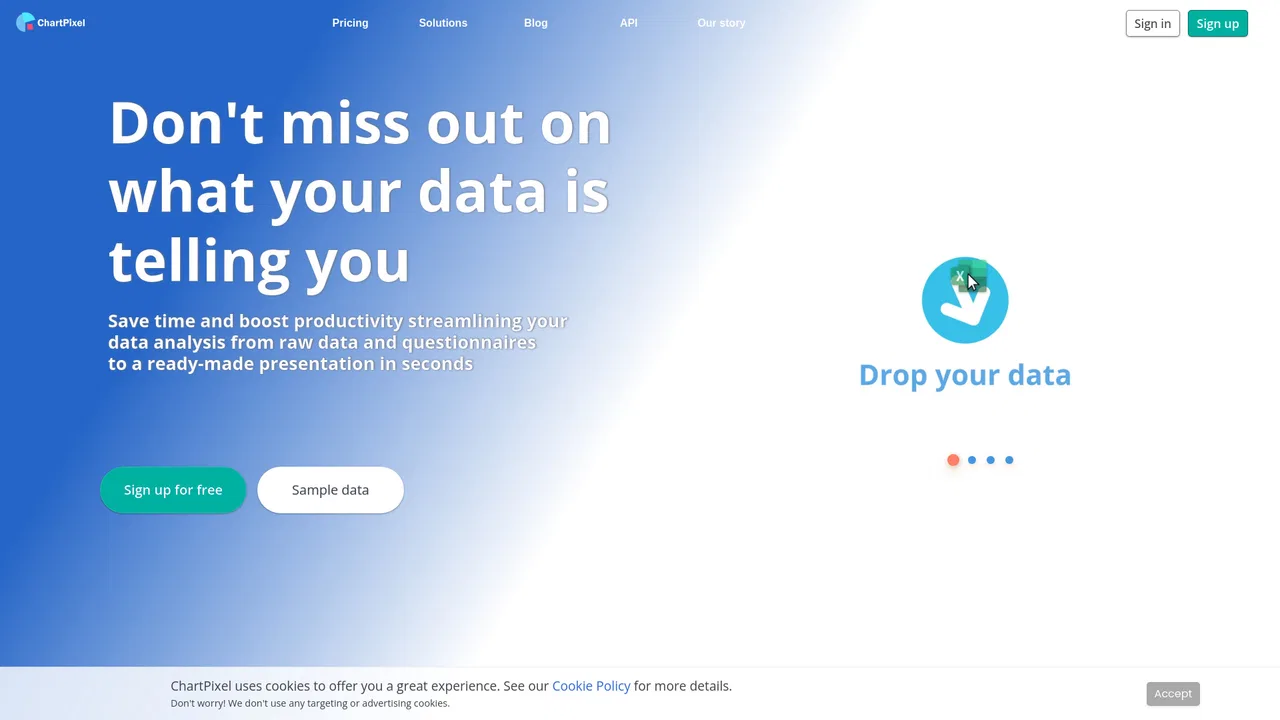
ChartPixel turns messy spreadsheets, surveys and webpage tables into interactive charts, written insights, forecasts and statistical tests. Upload a file, and the platform cleans and enhances the data, picks the most useful chart types, explains what each one shows, and lets you chat with your data.

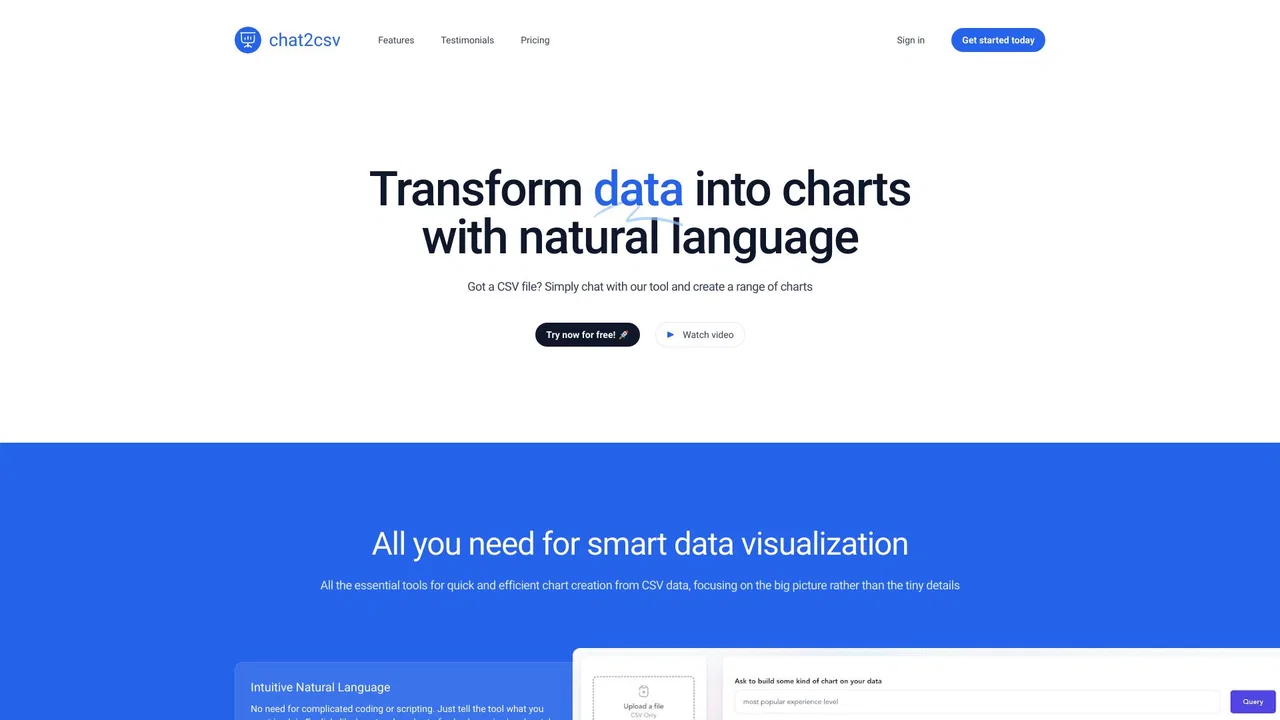
Turn spreadsheets into charts by just asking in plain English